
Login
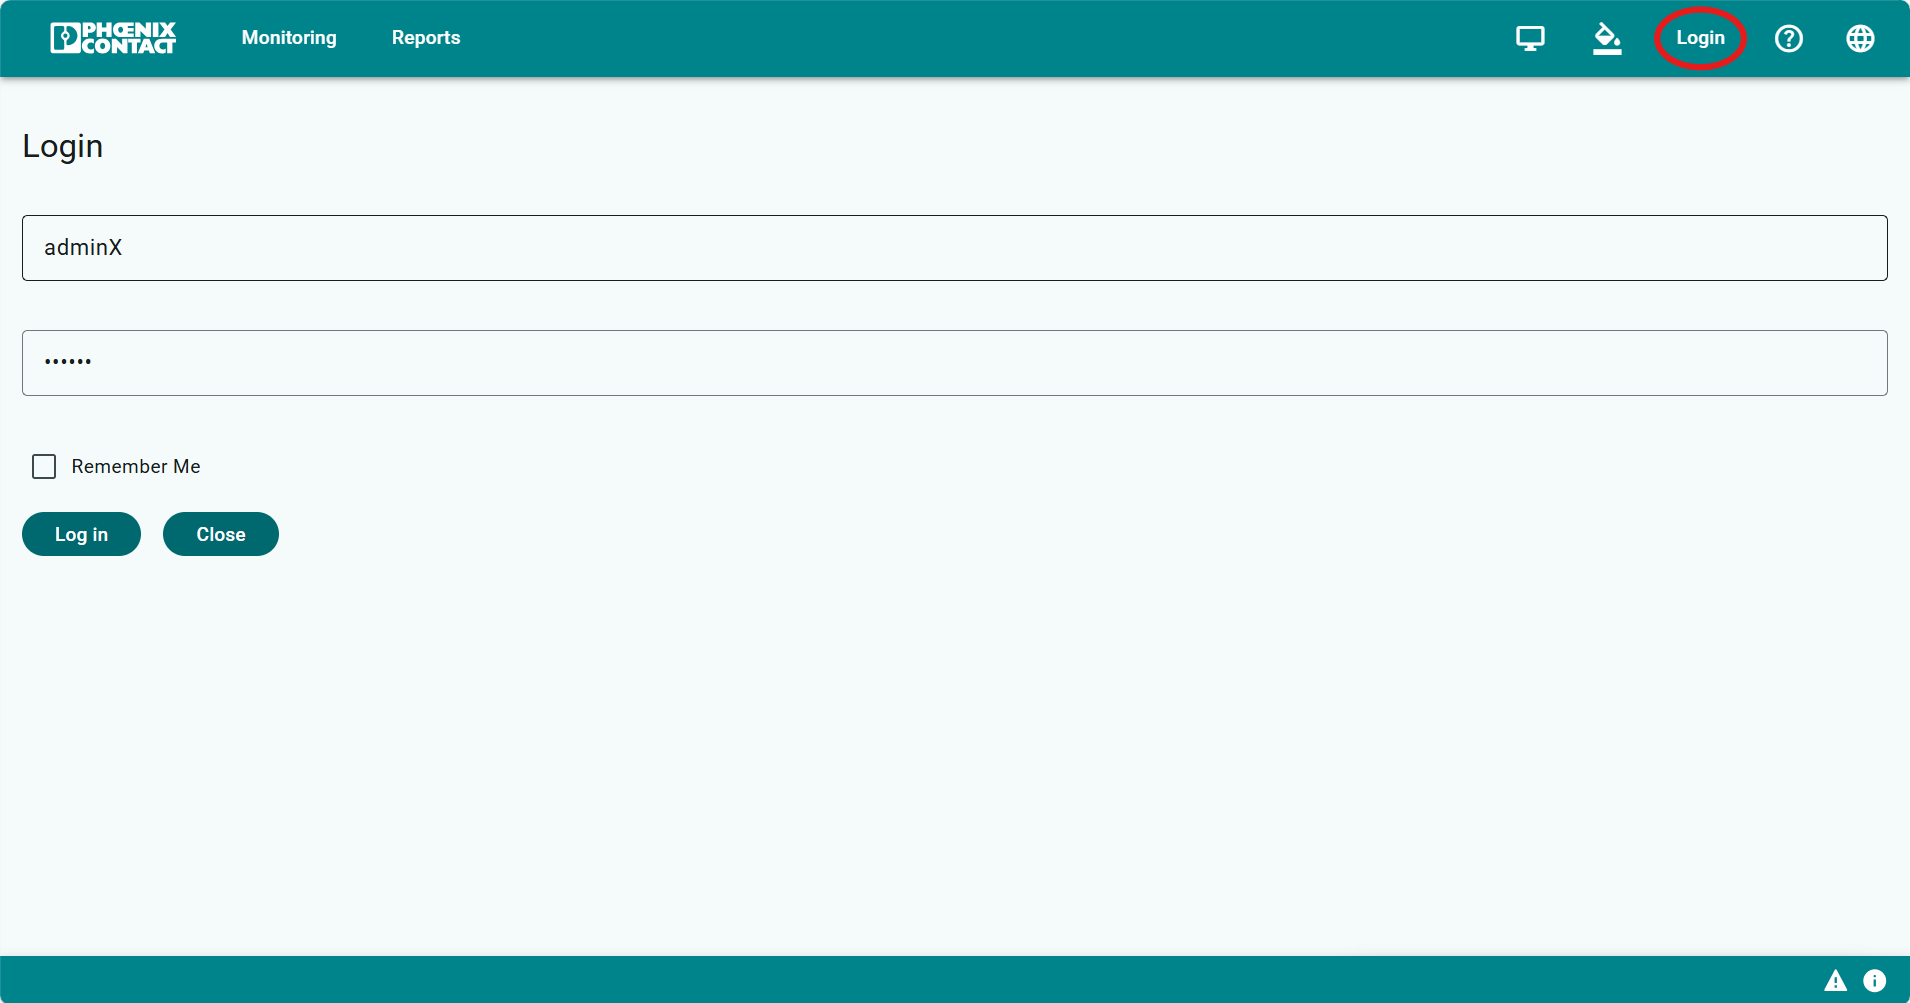
To start on our Demo-Server you need to Login with credentials.
Please use the following:
Username: admin10Password: adm1n10
After the login you can start using the demo.
Dashboards
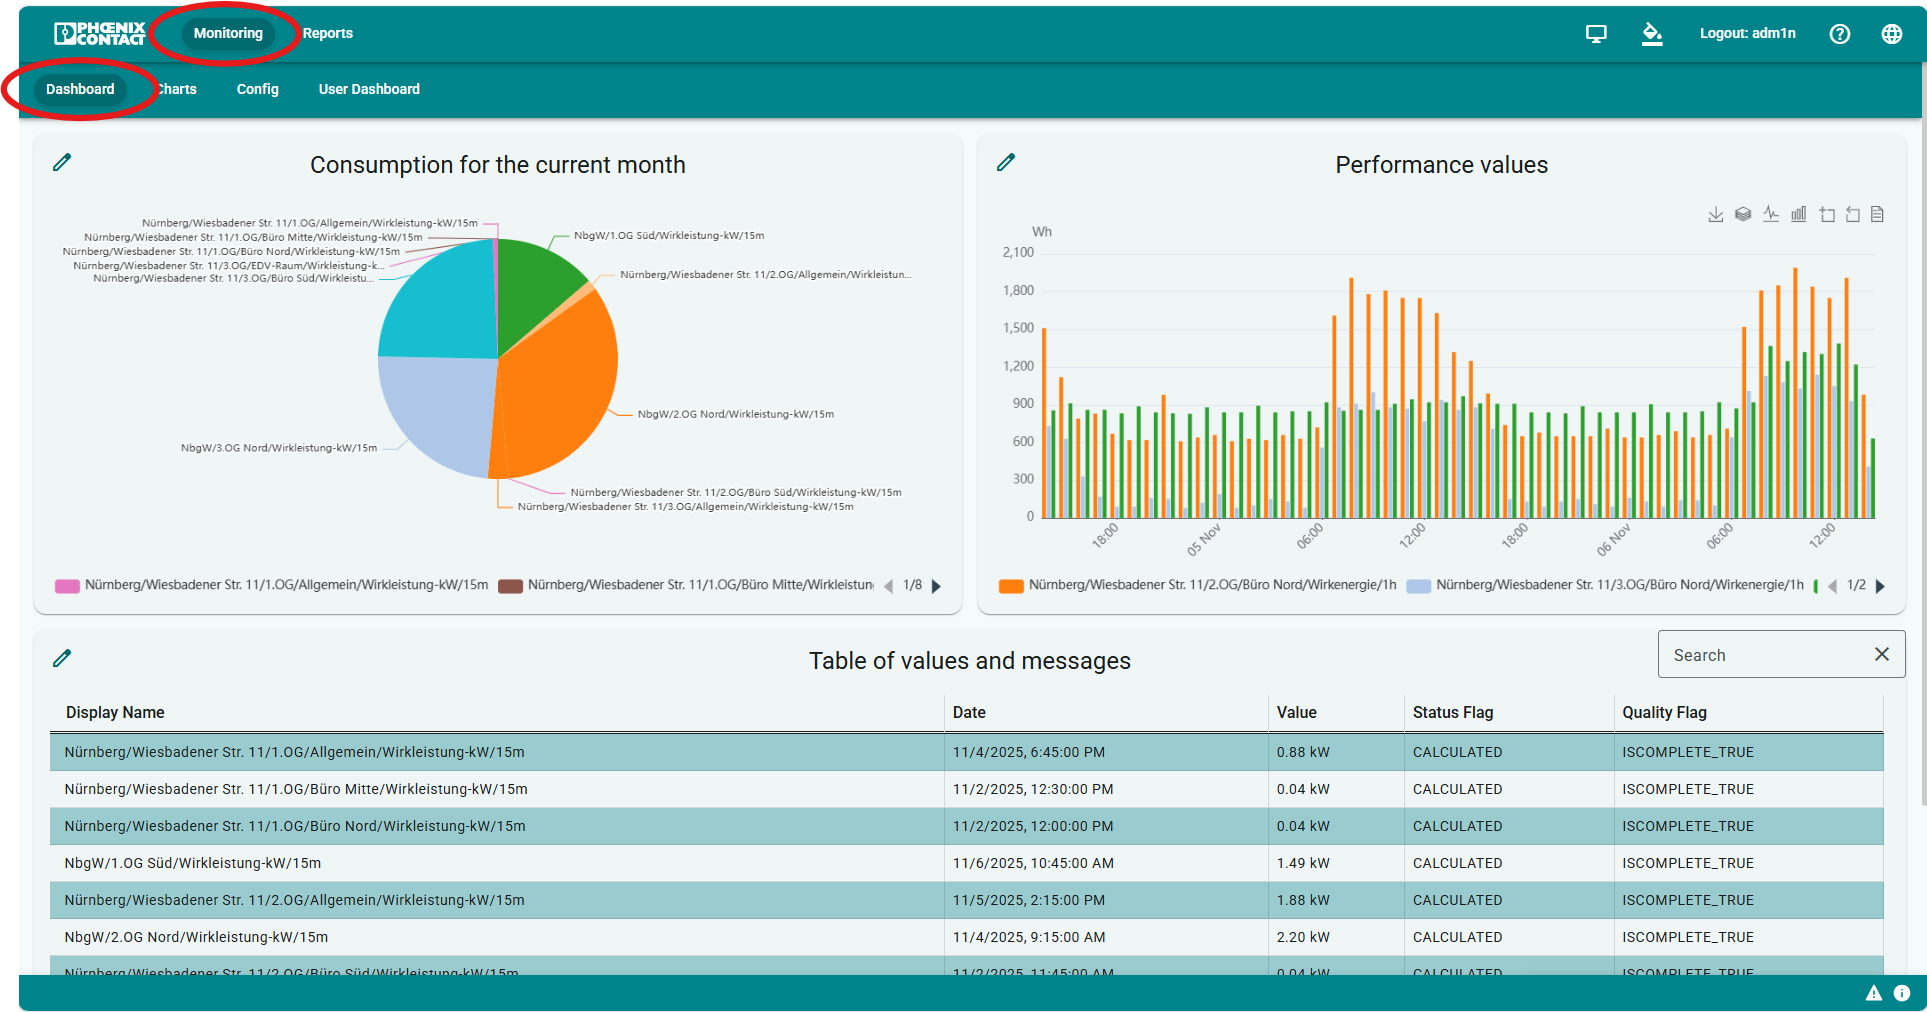
In the Monitoring Section there are different Dashboards for views on the datapoints. On the customizable main dashboard you can see the monthly energy use of a building and also daily values. In the table view the highest energy values of the last days are shown.
Charts
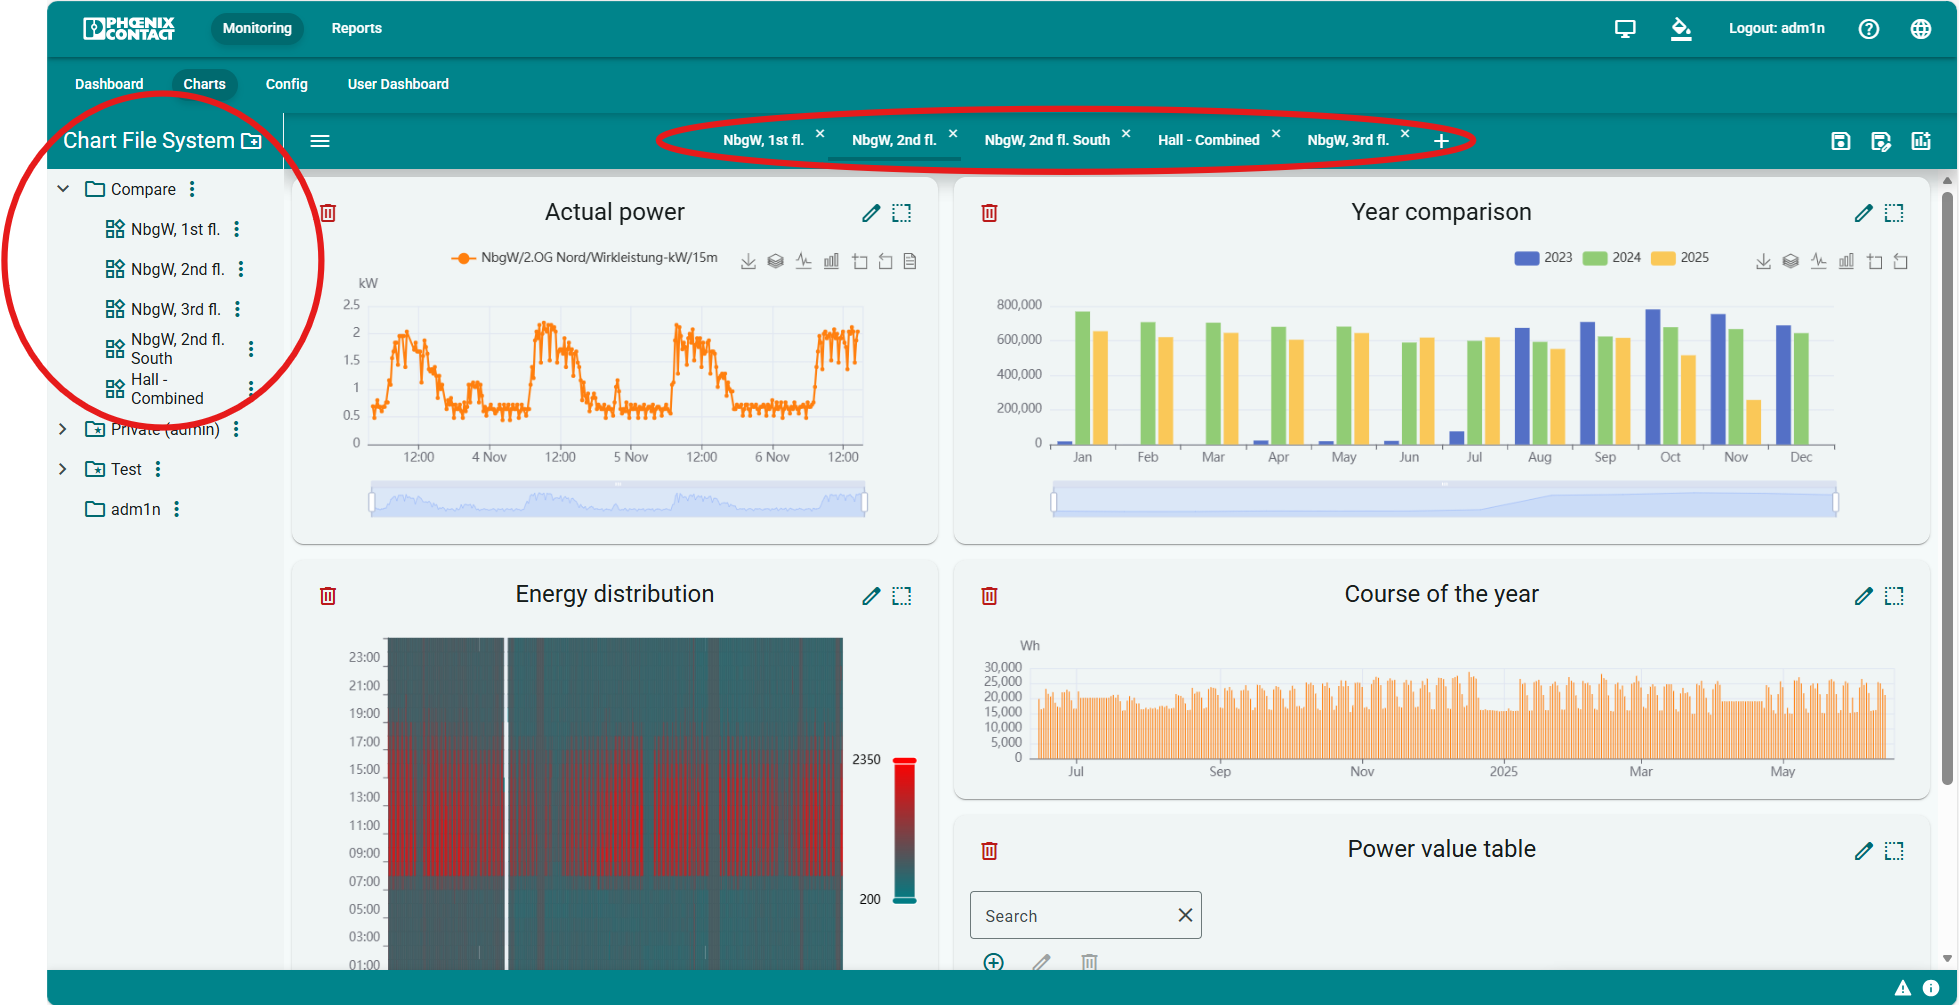
In the Charts Section you can create as many different charts as you want.
On the left the Chart file system already shows one dashboard for each floor of an office building. In every dashboard different information is shown and new snippets can be created additionally.
Reports
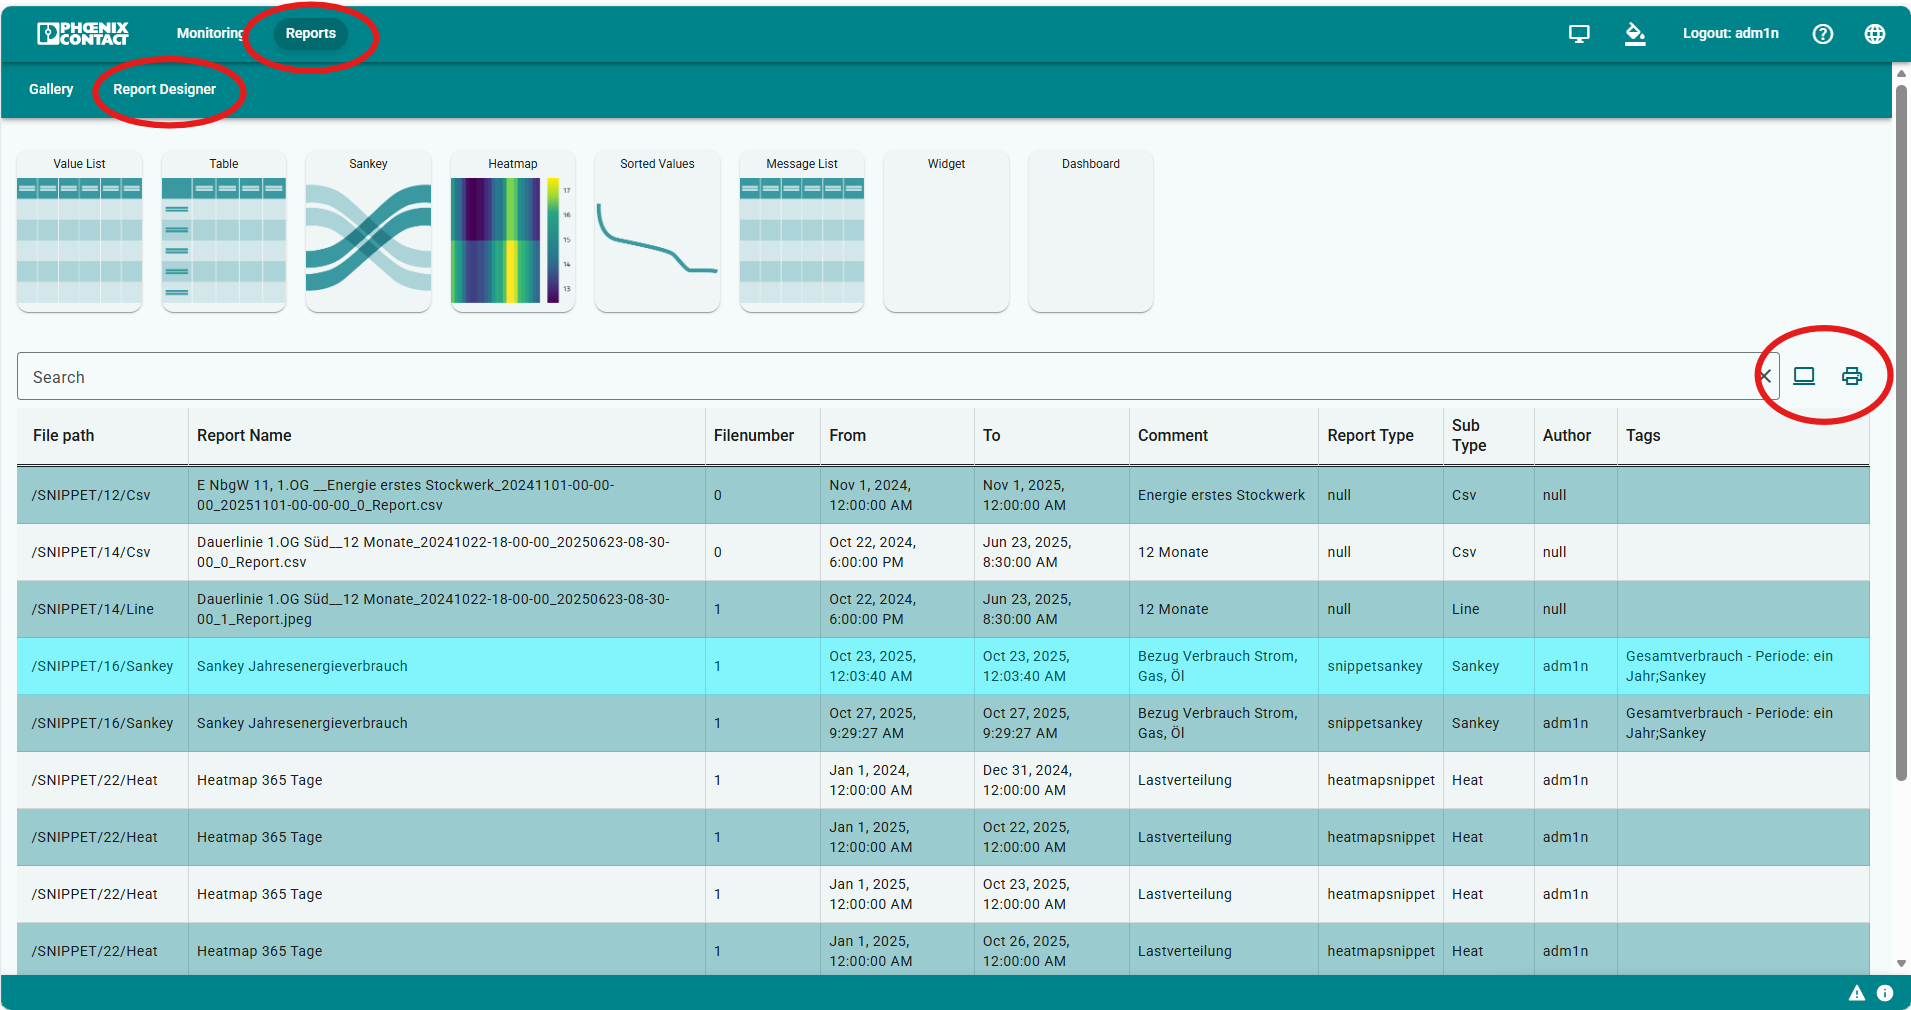
In the Report Section the already created Reports are shown in a Gallery.
The Reports are sent via email automatically but can also be opened here.
To see the different reporting options and create new reports you can open the Report Designer Section.